Use the Operation Performance report to monitor the main metrics for conversations and new contacts served by your team.
In it, you view indicators for volume, response time, and operational efficiency, and you can filter the data by groups and by period for more detailed and comparative analyses.
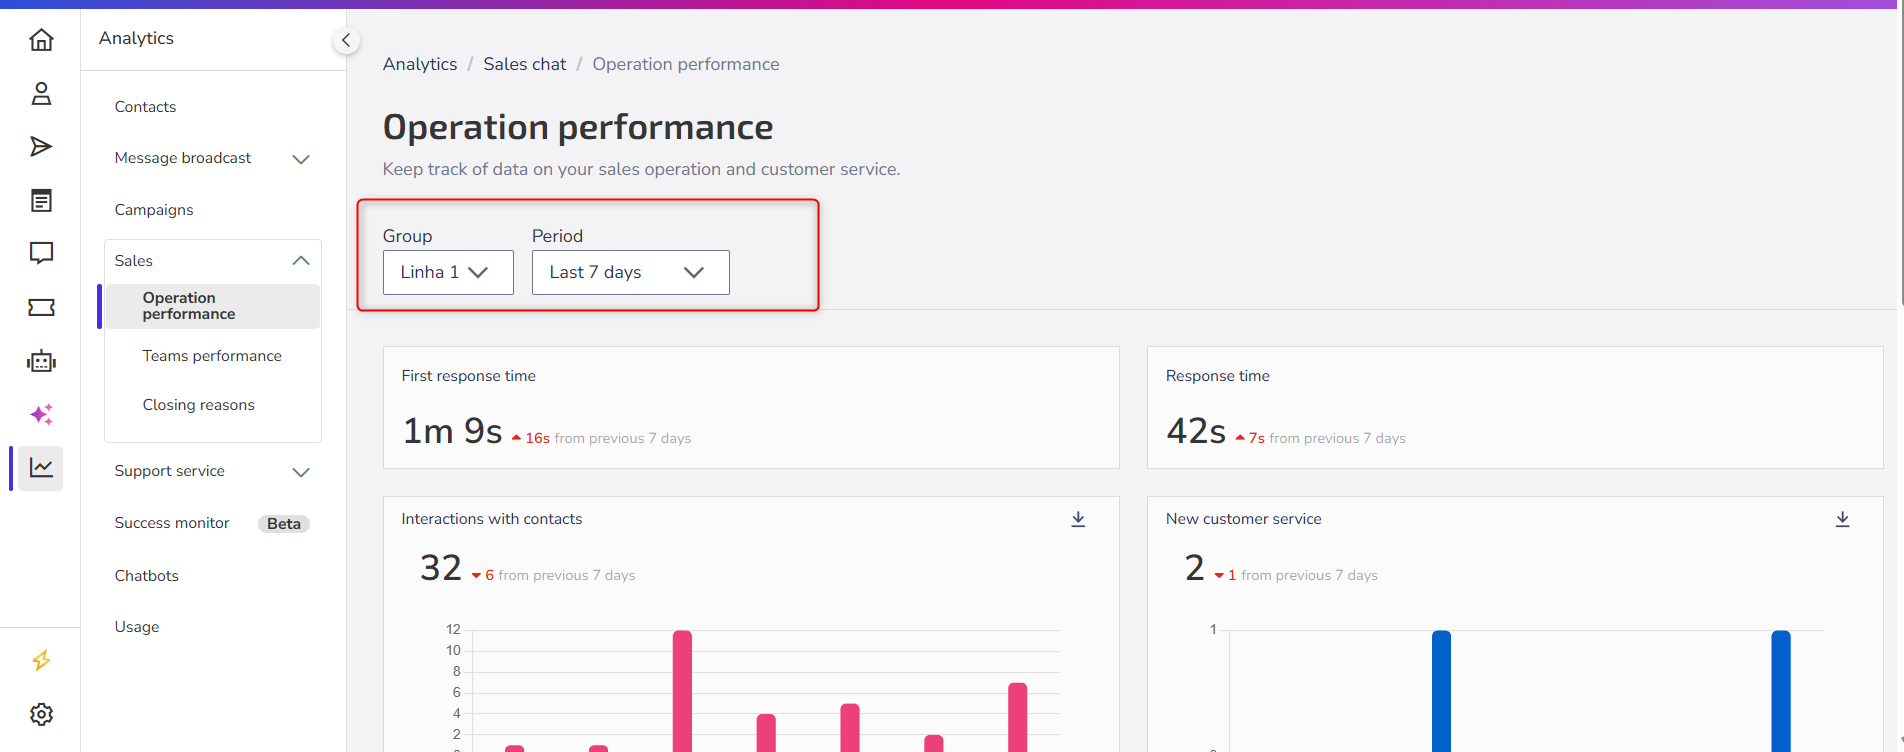
How to access
Access in Analytics > Sales > Operation performance
How to use
Use the filters by group and period to view only the data relevant to your analysis. It is possible to filter by: Today, Yesterday, Last 7 days, Last 30 days, This month, Last month or Custom period.
The metrics automatically display the comparison with previous periods, making it easier to identify evolution or decline in performance.
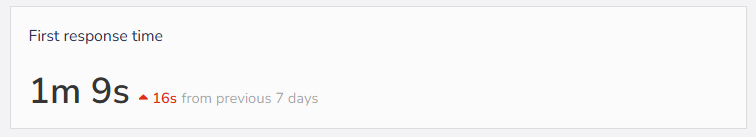
First response time
The first response time is a median of the time your team takes to respond to a new contact. The metric is the calculation of the time from the creation of a contact (who sent a message to your company) to the first response from an agent.
This metric does not consider users who are outside business hours, nor quick responses or those coming from the bot flow.
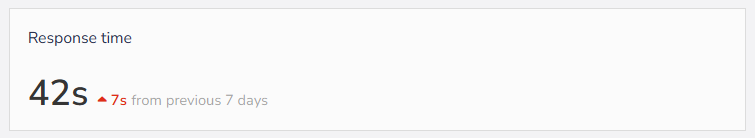
Response time
This is the median of the time that the team in general takes to respond to a service interaction where the conversation is already open, calculating not only the first response, but each time there is an interaction with the same contact.
This metric disregards business hours and the time taken for automatic responses. We use the median instead of the average so that our metrics represent your team's work.
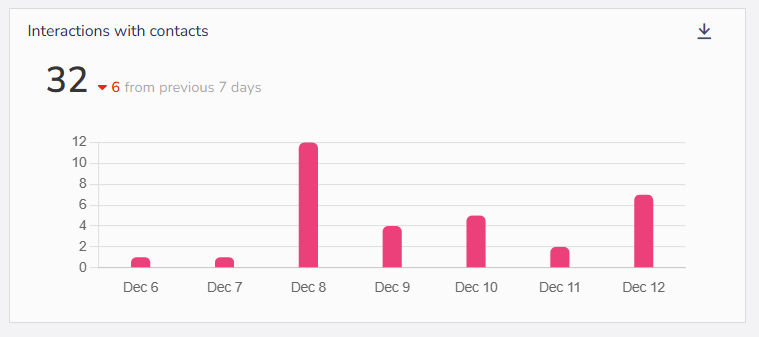
Interactions with contacts
In this metric, you see the quantity of contacts your team interacted with per day during the selected period.
If a user interacted with a contact more than once on the same day, only one interaction will be counted. And if they interacted with a contact more than once on different days, one interaction per day will be counted. The final number is the sum of the daily values.
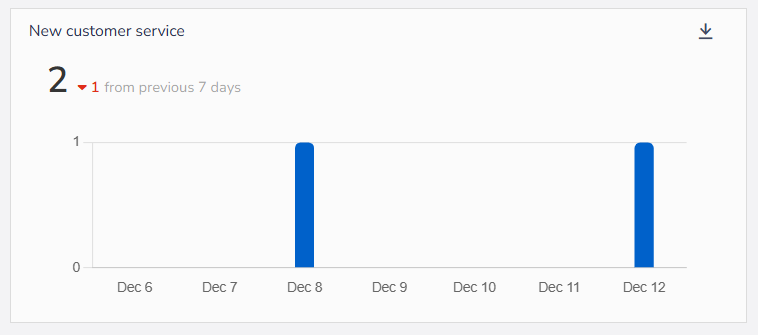
New customer service
Here you see how many contacts were created during the selected period.
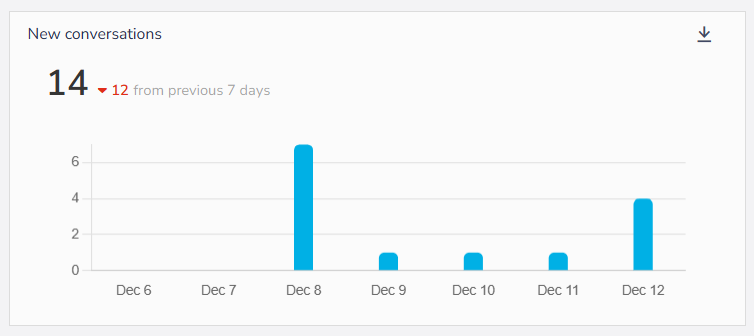
New conversations
Compares the performance of each contact source by the number of started and closed service interactions. A contact can have several service interactions.
The table is updated hourly with new information.
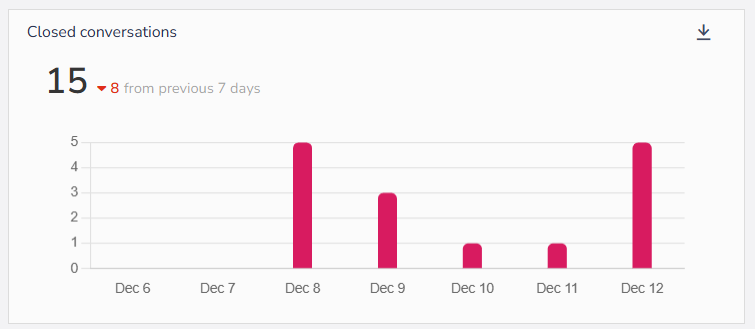
Closed conversations
See how many conversations your team closed in the selected period. Conversations end when contacts are closed, archived, or transferred.
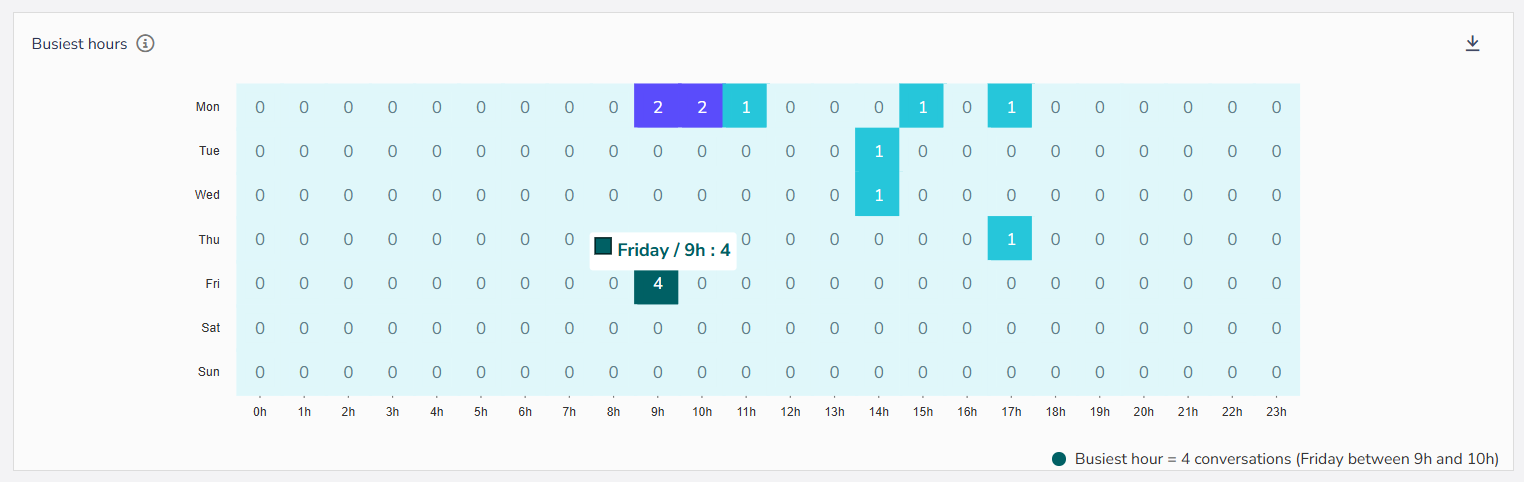
Heatmap - Busiest hours
This chart is a heatmap that shows the days and times with the most active conversations. With these metrics, you can better distribute your team's working hours.
The information is not updated in real-time and the chart does not take into account the date when the contacts were created, but rather when there is a larger number of conversations.